

A review of Emerson’s reported COVID-19 data reveals severe shortcomings in the college’s dashboard, which intends to provide insight into the virus’ presence in the community.
The regularly updated dashboard has been riddled with reporting and mathematical errors, a Beacon investigation found. In addition, it is missing several metrics two public health experts said are crucial to painting an accurate picture of the virus’ spread at Emerson.
“As a general principle, it’s concerning if the numbers are bouncing around, because then you have to question well, why were they?” Dr. Michael Siegel, a professor of community health sciences at Boston University, said in an interview. “Which one is correct? And why were they wrong in the first place?”
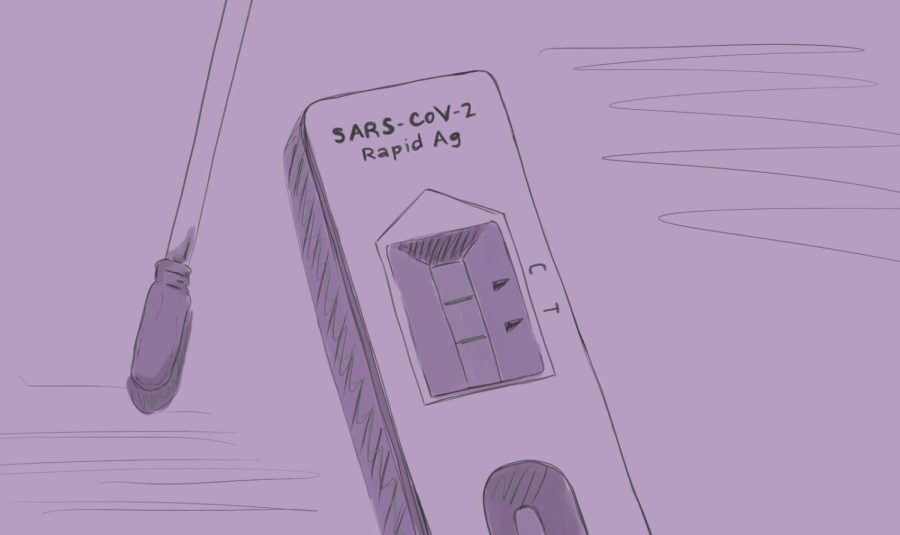
Cases at Emerson have remained low since the college’s reopening in August. As of publication, the college reported 19 positive tests out of 23,781 tests administered between Aug. 6 and Oct. 7. The reported positivity rate sits at .08 percent. (All students must be tested weekly; faculty and staff were given the choice to opt-in to weekly tests.)
Other New England schools, like Boston College and Providence College, by contrast, have struggled to contain the virus on their campuses. Providence College reported 240 positive cases, while BC reported 188 to date.
Still, Emerson’s dashboard displayed inaccurate information in at least one of its metrics more than 30 percent of the time—or seven out of 21 days—in the last month, The Beacon’s reporting found.
A statement from Emerson administrators, in response to a detailed list of inaccuracies on the dashboard, said the tracker aims to be as insightful as possible.
“The College’s goal for the dashboard has always been to present a snapshot of data from our community testing program…as clearly as possible, and we are always looking for ways to improve and respond to our community’s feedback,” the statement read.
Data reporting errors
Since the college transitioned to daily updates on Sept. 8, a team of Beacon reporters uncovered a series of errors on the dashboard.
The dashboard displays the college’s cumulative testing totals for both positive and total tests. It also shows the test positivity rate alongside testing numbers for each day.
College officials first opted for weekly, and then twice weekly updates, before eventually settling on posting testing information daily, Monday through Friday. Almost every other local institution began the semester with daily updates.
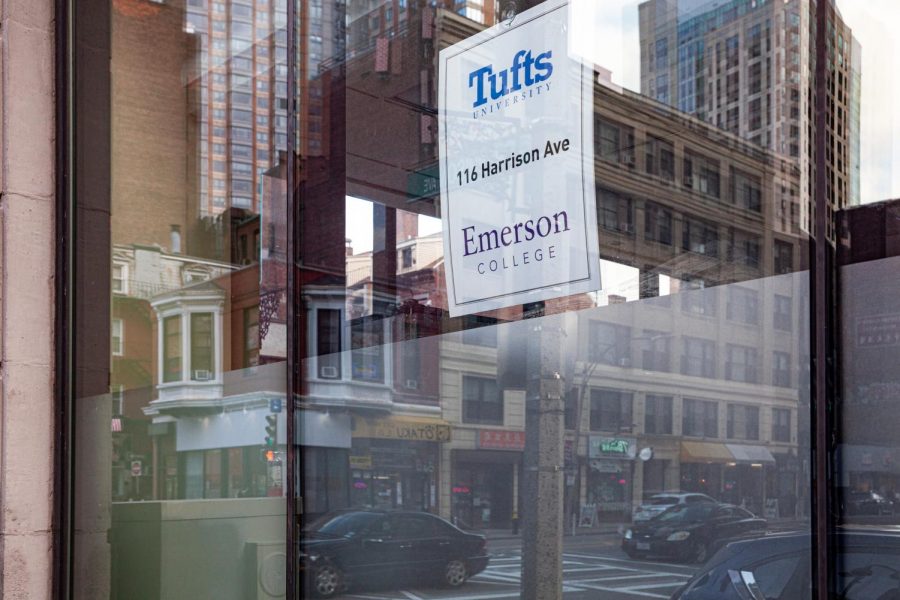
The dashboard is not updated on weekends because Emerson’s testing site at Tufts Medical Center is closed on Saturdays and Sundays, administrators said.
Over the last three weeks, The Beacon noted seven separate days where inaccuracies or discrepancies were present on the dashboard. That means out of 21 days of testing data, or three weeks with weekends excluded, the dashboard displayed at least one incorrect metric 33 percent of the time. At least one time, on the night of Sept. 15, testing data changed overnight without explanation.
Since the switch to daily updates, reporting errors have become a regularity.
When presented with a detailed list of reporting errors sent to the college via email Monday, administrators said the current data reporting process has “resulted in some errors that we have since corrected.”
The college did not comment on nine specific incidents The Beacon detailed in its list and notes throughout this story.
College administrators attributed the inaccuracies to human error. In a statement to The Beacon on Sept. 21, a spokesperson said Emerson’s IT and Web Services departments are responsible for inputting data into the dashboard.
“Every morning, Emerson IT posts a file which reports on the testing data collected from the Broad Institute,” they told The Beacon. “Web & Digital Services then updates the Dashboard page with the new data….Separately Web and Digital Services receives updates on the isolation & quarantine numbers from [Assistant Vice President for Campus Life] Erik Muurisepp, and makes those changes soon after.”
Nancy Allen, a professor in the college’s Marlboro Institute with a masters degree in public health from Tufts University, said the manual data entry process is a “little weird.”
“I’m amazed that there’s not any sort of automation,” Allen said. “Because when you’re doing it by hand, it feels like they’re just leaving room for human error in there.”

The college’s statement to The Beacon on Oct. 7 indicates that Emerson intends to switch to an automated system, though a spokesperson did not immediately respond to questions about when the transition will take place.
“Going forward, we will be moving to an automated system of updating the dashboard that will minimize room for error, and ensure that the dashboard is updated at the same time everyday,” the statement reads.
The most frequently misreported metric is the cumulative testing total, or the number of total tests conducted since early August. That total is used by the college to calculate the test positivity rate.
The Beacon counted three separate occasions when daily or weekly testing totals did not add up to the cumulative total displayed on the tracker. In one instance on Sept. 24, more than 800 tests were added to the cumulative total overnight, though the dashboard still said its last update came the day before at 2 p.m.
A college spokesperson said in a statement that data can change overnight when more test results are received from the Broad Institute at Massachusetts Institute of Technology, which is responsible for processing the Emerson tests administered at Tufts Medical Center.
“Please also note the dashboard reflects point-in-time results, and test numbers for recent test dates may change as more data comes in from the Broad,” the statement reads.
The spokesperson did not provide an explanation for the mathematical discrepancies in the data, or the incorrect timestamps on the dashboard.
The number of positive tests recorded on a weekly or daily basis has also fluctuated from what the dashboard first reported on multiple occasions.
[elementor-template id=”55915″]
On the week of Aug. 24, the dashboard, when first updated, reported three positives. Then, the day after that update, the weekly total of positive tests shifted to eight without explanation. Now, archived data on the dashboard lists the total of positive tests that week as five.
In another instance on Sept. 9, three positive tests were reported in one day, but the cumulative total of positive tests remained the same as it was the day before.
For the last month, Beacon reporters have questioned administrators, specifically Muurisepp, who serves as the college’s “COVID Lead,” on the documented reporting errors. On most occasions, Muurisepp said he was unaware of the errors, telling reporters that he would look into the specific incidents in question.
In those interviews, Muurisepp acknowledged some of the errors presented by reporters but did not comment on a change to the data input protocol.
The switch to daily updates was made to give the community “real-time information,” Muurisepp said.
The college has not explained the rationale behind the manual reporting process.
Missing metrics
Allen and Siegel said multiple valuable data points are missing from the dashboard.
Without those key metrics—which are included in dashboards at Northeastern University, Boston University, Suffolk University, and Harvard University—Emerson’s dashboard is not wholly indicative of the virus’ presence at the college, they said.
One metric that currently paints an inaccurate or incomplete picture of coronavirus at the college is on-campus quarantine or isolation data. That datapoint does not include students quarantined or isolated off-campus, as well as faculty and staff quarantined at home—an oversight Allen, who teaches Emerson’s “Plagues and Pandemics” course, said could be misleading.
“They’re only keeping track of people on campus,” Allen said in an interview. “That’s not indicative of the entire community. I worry that by only including people who are on campus, they are artificially lowering the number of community members in isolation and quarantine.”
Siegel said there is no public health argument for excluding the specific numbers.
“That’s just common sense, I don’t understand why you would not want to include [off-campus students],” he said. “They’re students at the school and they’re contributing towards potential spread in the community. I don’t understand the logic of not including them in the first place.”
Also missing from the dashboard, Allen and Siegel said, is a breakdown of testing data among students, faculty, and staff. Currently, the dashboard does not specify which groups of community members testing data applies to. This does not allow the public to see where clusters may be forming, Allen said.
“With all the protocols in place, if there’s transmission happening in places like a classroom setting, then that tells me that perhaps the protocols in place in the classrooms are not enough,” Allen said. “Transmission to faculty or staff, that does feel like that would be pertinent information about how protocols are working.”
Siegel said the delineation between the different community groups is significant because faculty and staff are statistically at greater risk of developing a severe or deadly case of COVID-19.
“It’s particularly important to separate out faculty and staff,” Siegel said. “When you start to see employees affected, that’s very different because employees, they’re diverse. They’re not all 18 to 21 year olds. They’re older. Many of them have pre-existing medical conditions and so infection in an employee is a much more serious situation than in a student.”
In past interviews, Muurisepp said that the college’s testing metrics do not delineate between students, faculty, and staff for the sake of privacy. But the college’s statement to The Beacon appeared to reflect a different line of reasoning.
“COVID-19 dashboards across different schools and universities vary widely, with each institution working to provide test results and information in a format that makes sense for their community,” the statement reads. “For example, rather than separate out students, faculty, and staff, as some schools do, Emerson’s dashboard displays test results for all community members, which is reflective of our unified and tight-knit community.”
The college’s dashboard also does not include data for those who have recovered from COVID-19, a metric included on most other local dashboards.
By Sept. 9, two metrics—hospitalizations and the rate of invalid tests—-had been removed from the dashboard. Removing hospitalizations, Muurisepp said in an email, was intended to make the dashboard more transparent. He labeled invalid test results “not valuable” data.
“Our aim was to provide as complete a picture of the virus’s impact on the community as possible, but we have come to realize that, unlike universities with affiliated medical centers, we have no way to track those numbers with 100 percent certainty,” Muurisepp said. “As full transparency and accuracy are our ultimate goal in presenting the dashboard, we felt it best to leave hospitalizations off.”
Another metric at least one epidemiologist considers misleading is the college’s reported test positivity rate. The current number being reported is the positivity rate of total tests, not the rate of positivity among community members. The test positivity rate is not truly reflective of the state of the virus at the college, Siegel said.
“The problem is that when [the dashboard] reports the percentage of positive cases, it’s reporting the percentage of positive tests,” he said. “What it should be reporting is the percentage of people who are testing positive, because what’s happening is people are being tested multiple times. So if one person gets tested, let’s say they get tested 30 times over the course of the semester, and they don’t test positive for any of those, they’re contributing 30 negative tests when really what you want to know is how many people are infected. So they should really only be counted once.”
The college did not respond to The Beacon’s questions regarding metrics not on the dashboard.
Charlie McKenna and Diti Kohli contributed to this report.


This headline and subsequent reporting foster unessential fear-mongering within the Emerson community. While some of the content you reported on was linked to the title, it was buried in the end after immense repetition of useless filler words. The article’s title delineates inaccuracies, so the first half doesn’t need to repeat that the Beacon found inaccuracies in their reporting investigation. The first mention of the “metrics” the Beacon found to be inaccurate was nearly halfway through the article.
Obviously there was a certain motivation behind this article, but it was unnecessarily confusing which is not something we should spread to the Emerson community. It upsets me to see a title so unlike a majority of its article’s content. You’re facilitating fear for clicks.